Storyboards and More:
Infographics Used in UX/UI Development
As a student with Thinkful, a UX/UI Bootcamp, I used a variety of infographics to present vital information during the UX/UI development process. I used graphics to display potential app users and their characteristics, demonstrate how an app is designed to be used, present competitive research and much more.
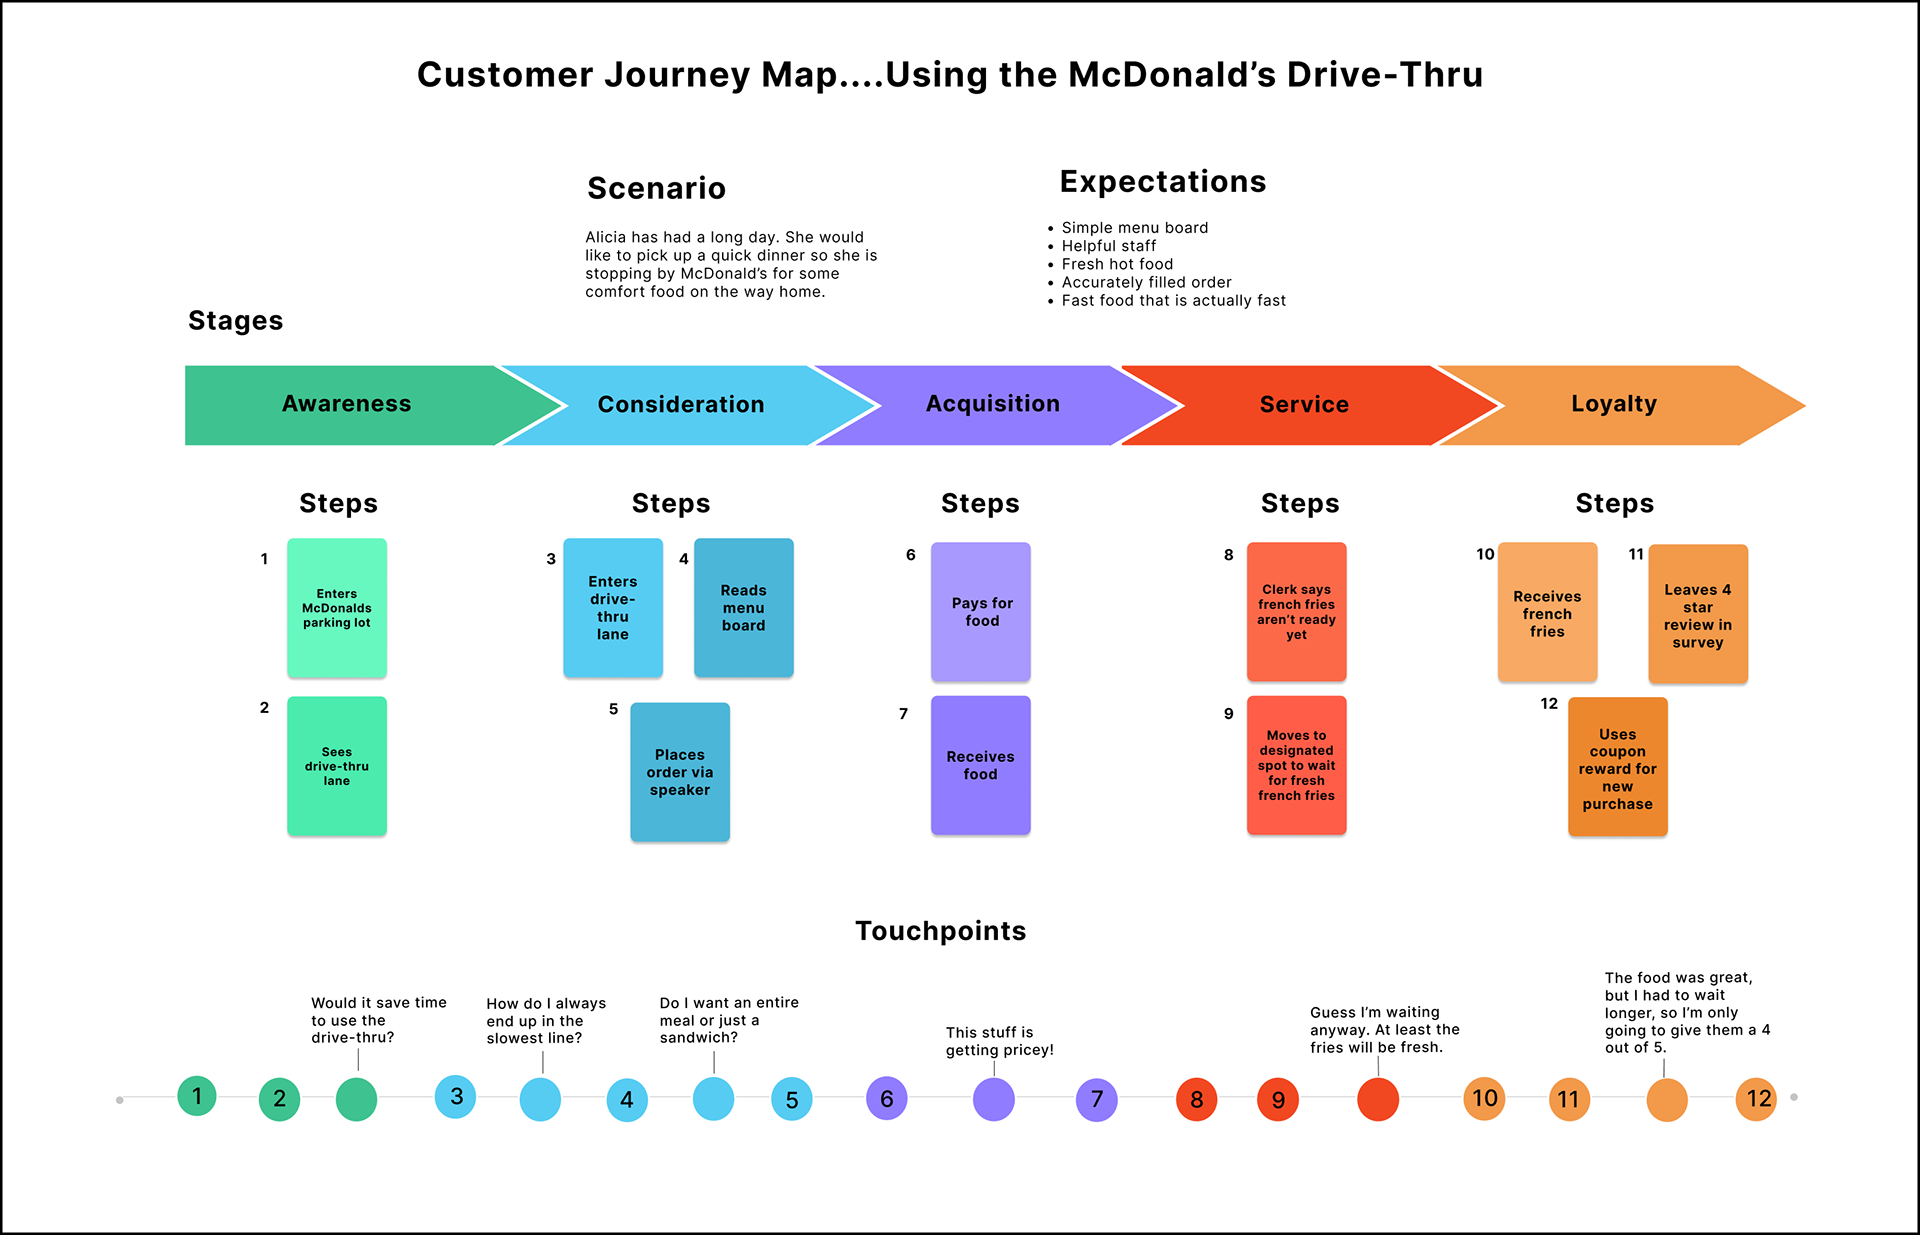
This customer journey map describes the process of going through the McDonald's Drive Thru.
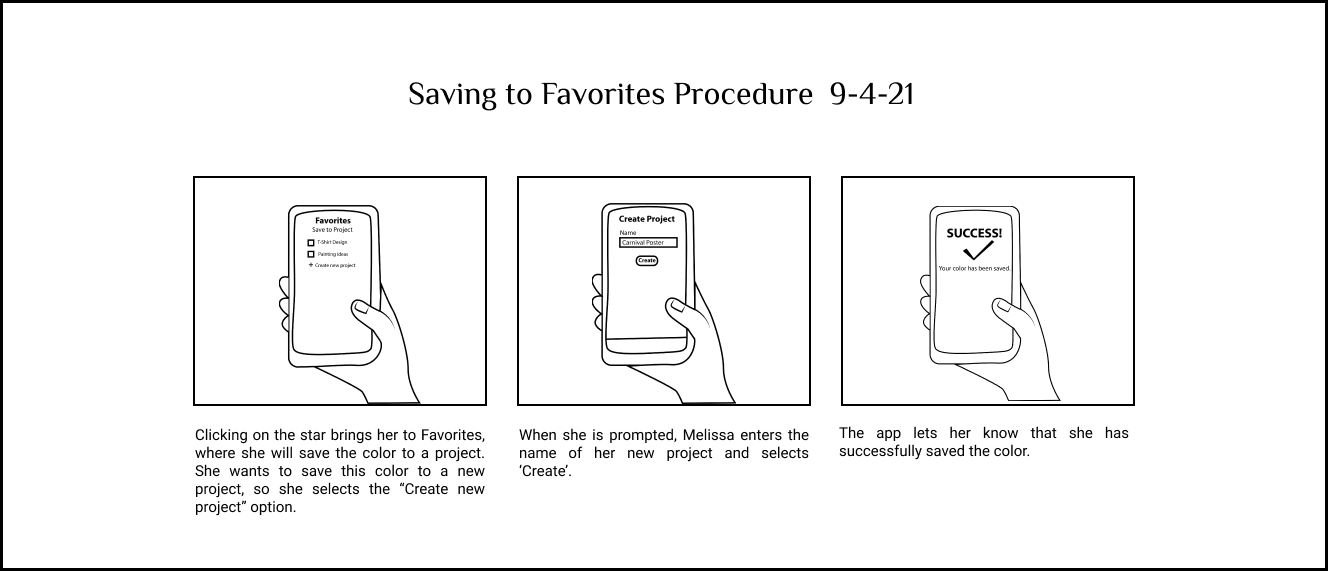
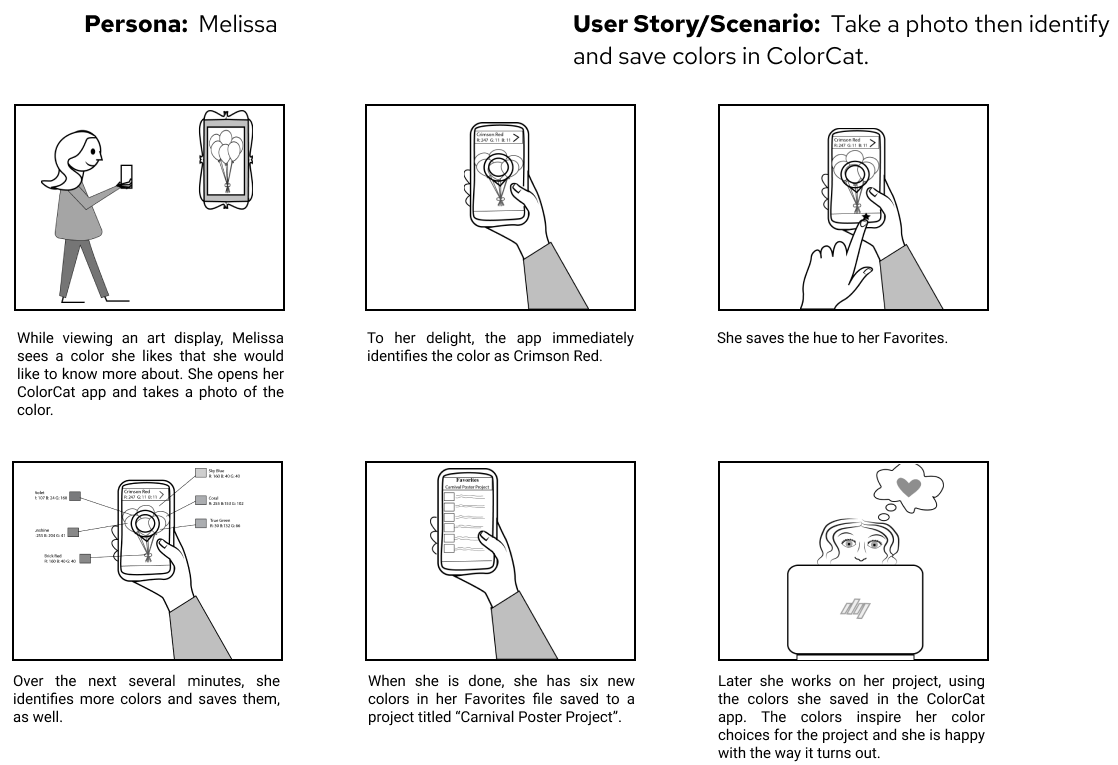
I drew this partial storyboard to demonstrate how to save to favorites in my ColorCat app.
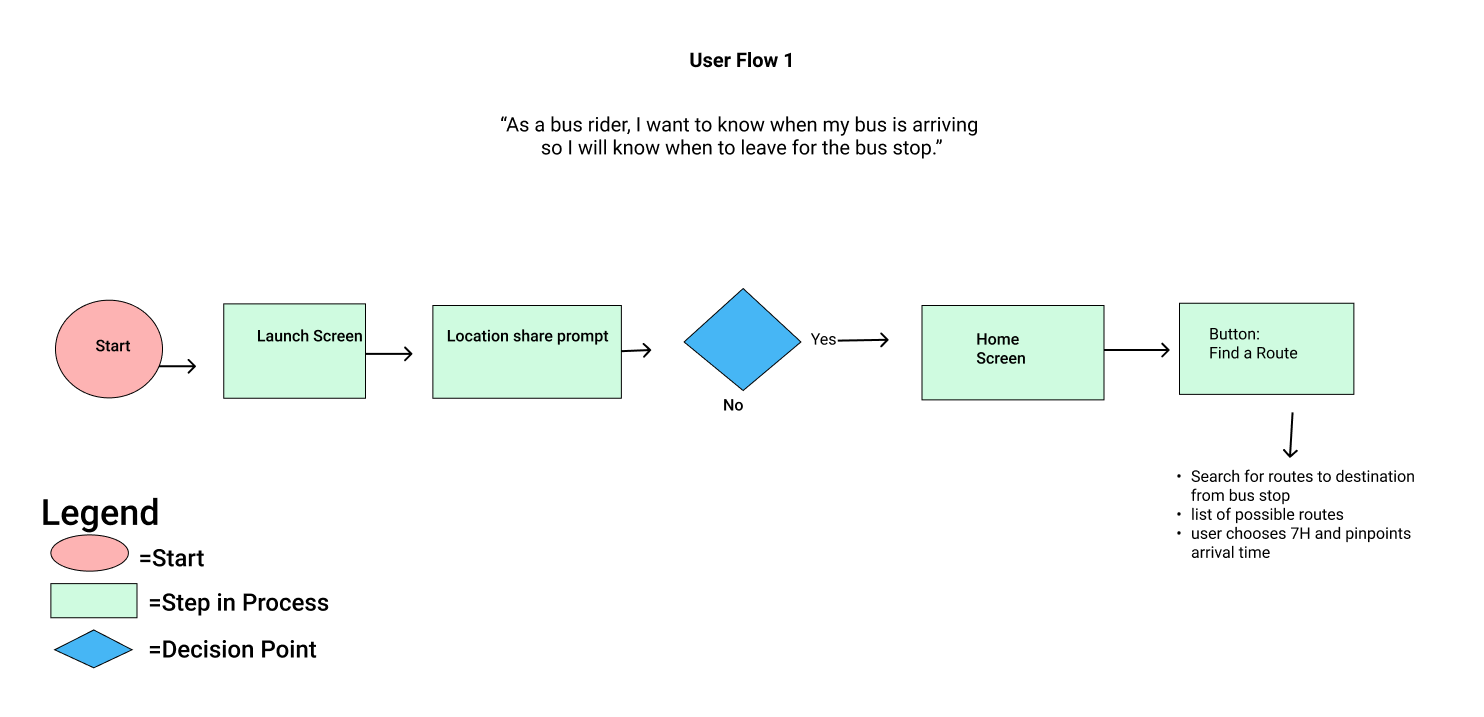
A "User Flow" chart.
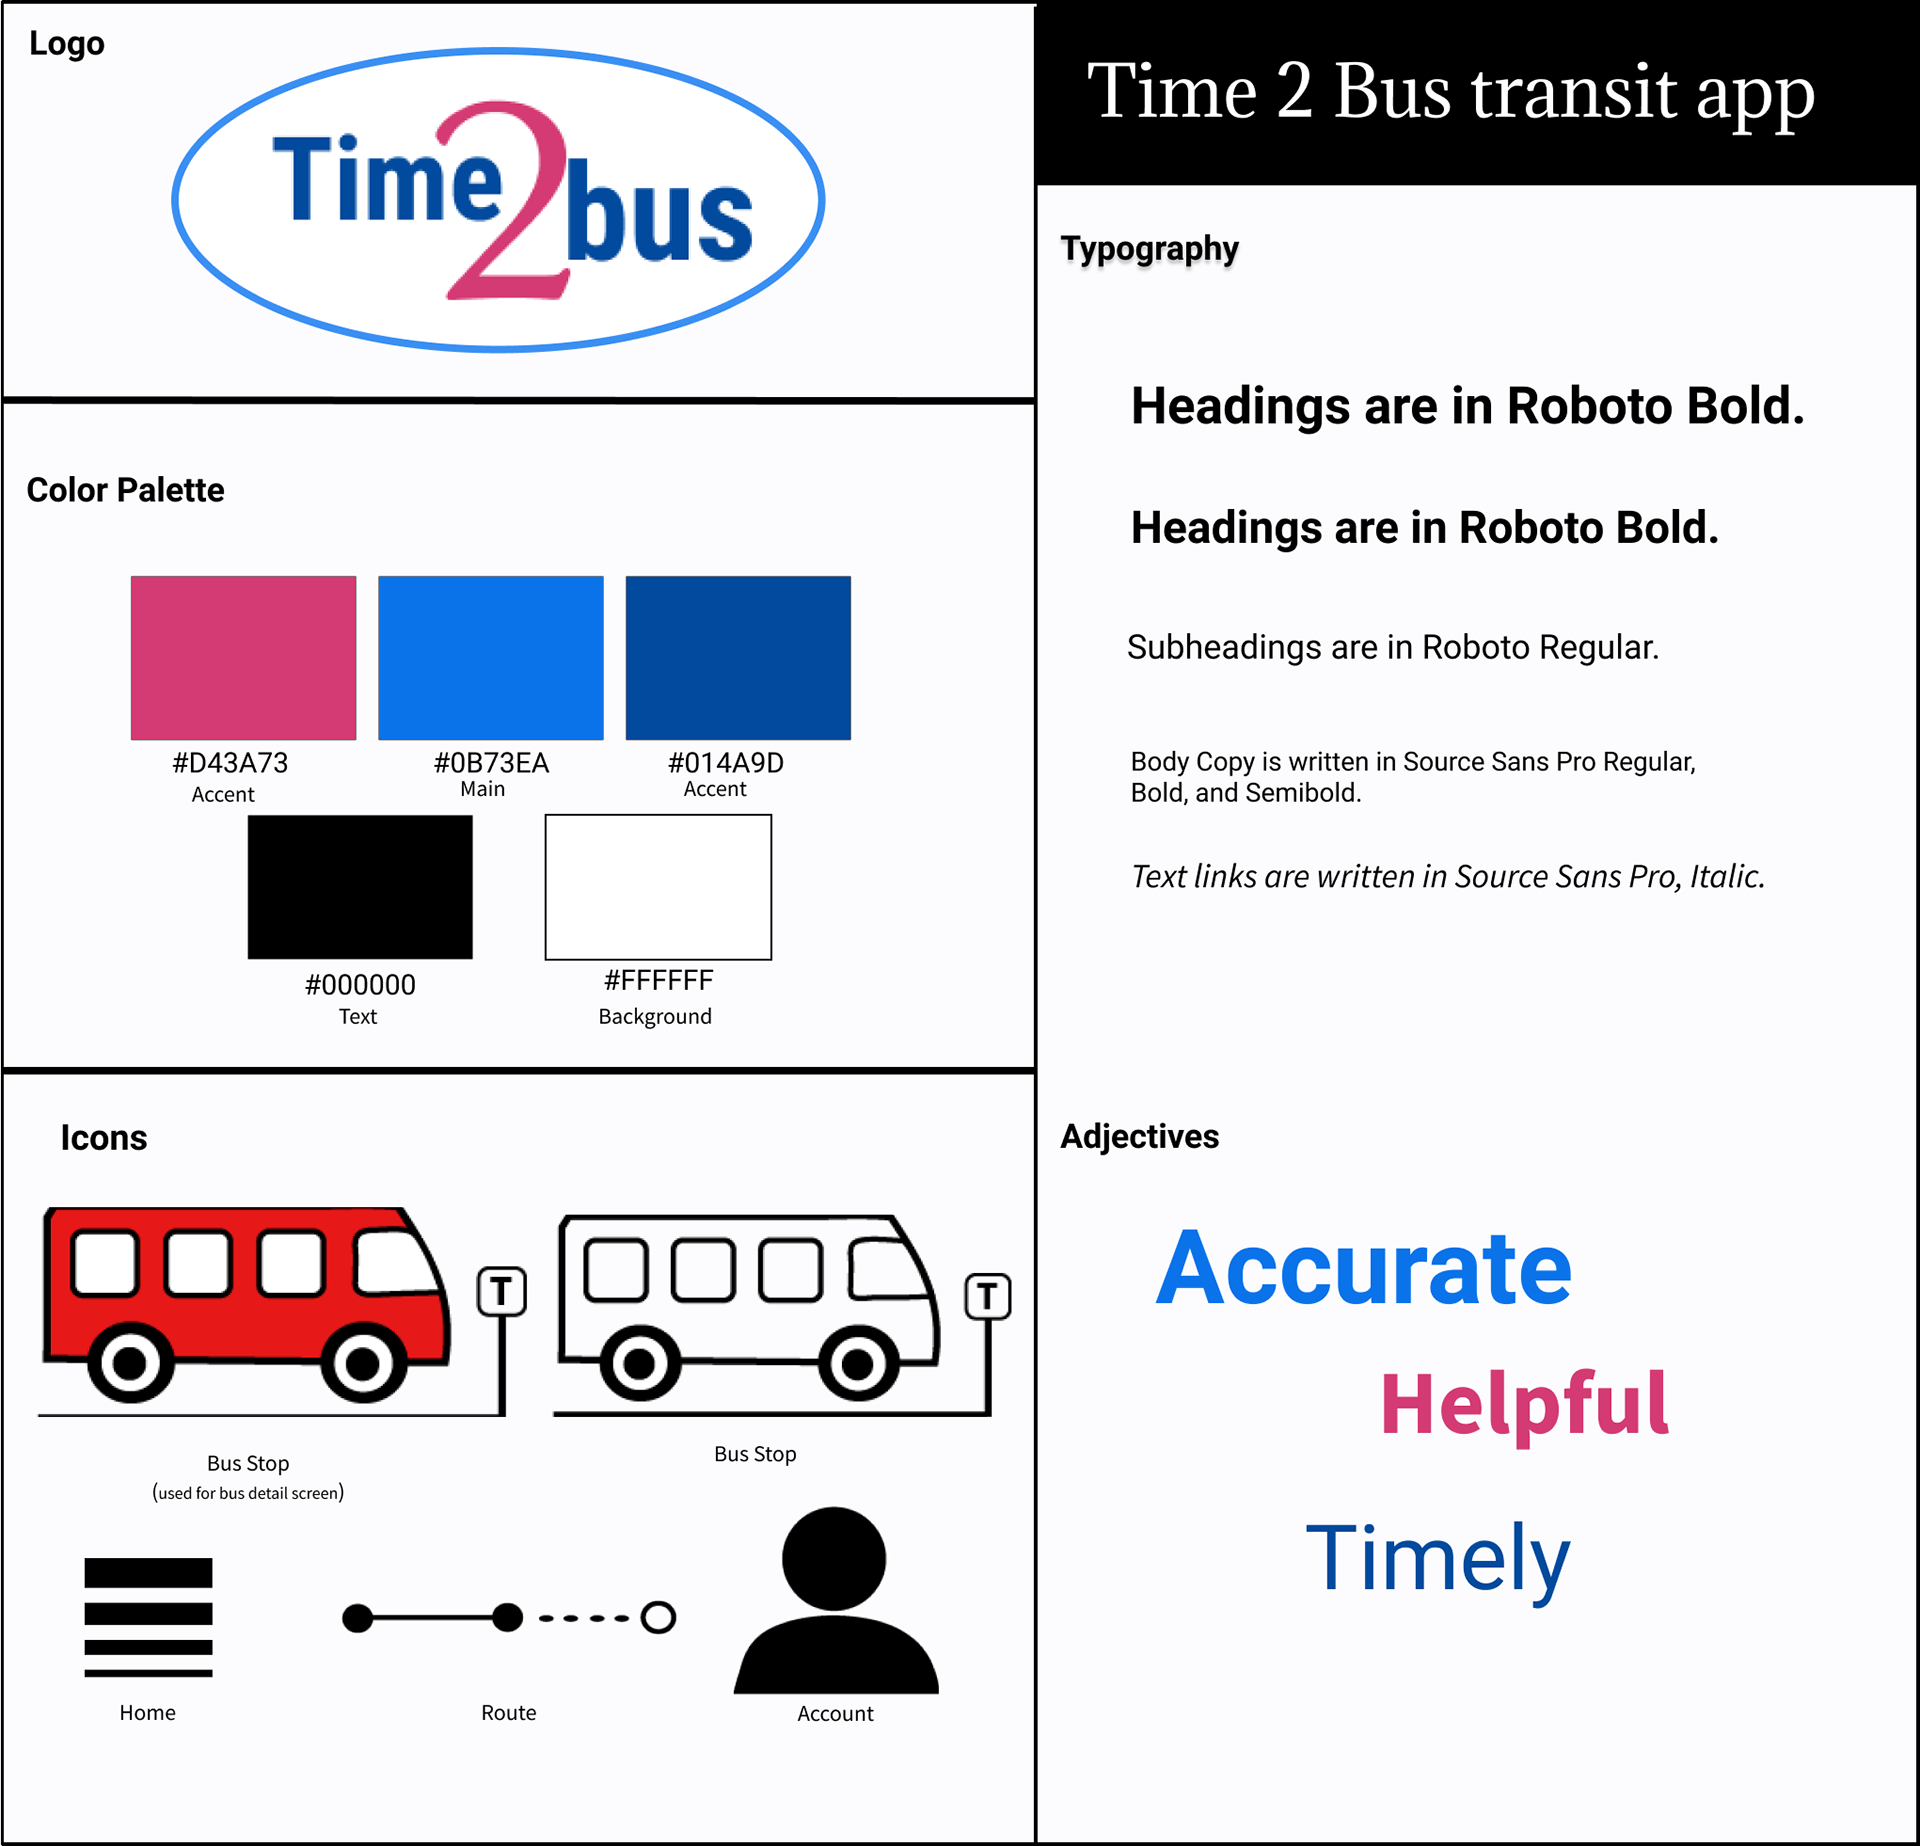
A style tile showing the logo, colors, text examples and icons for the Time2bus app.
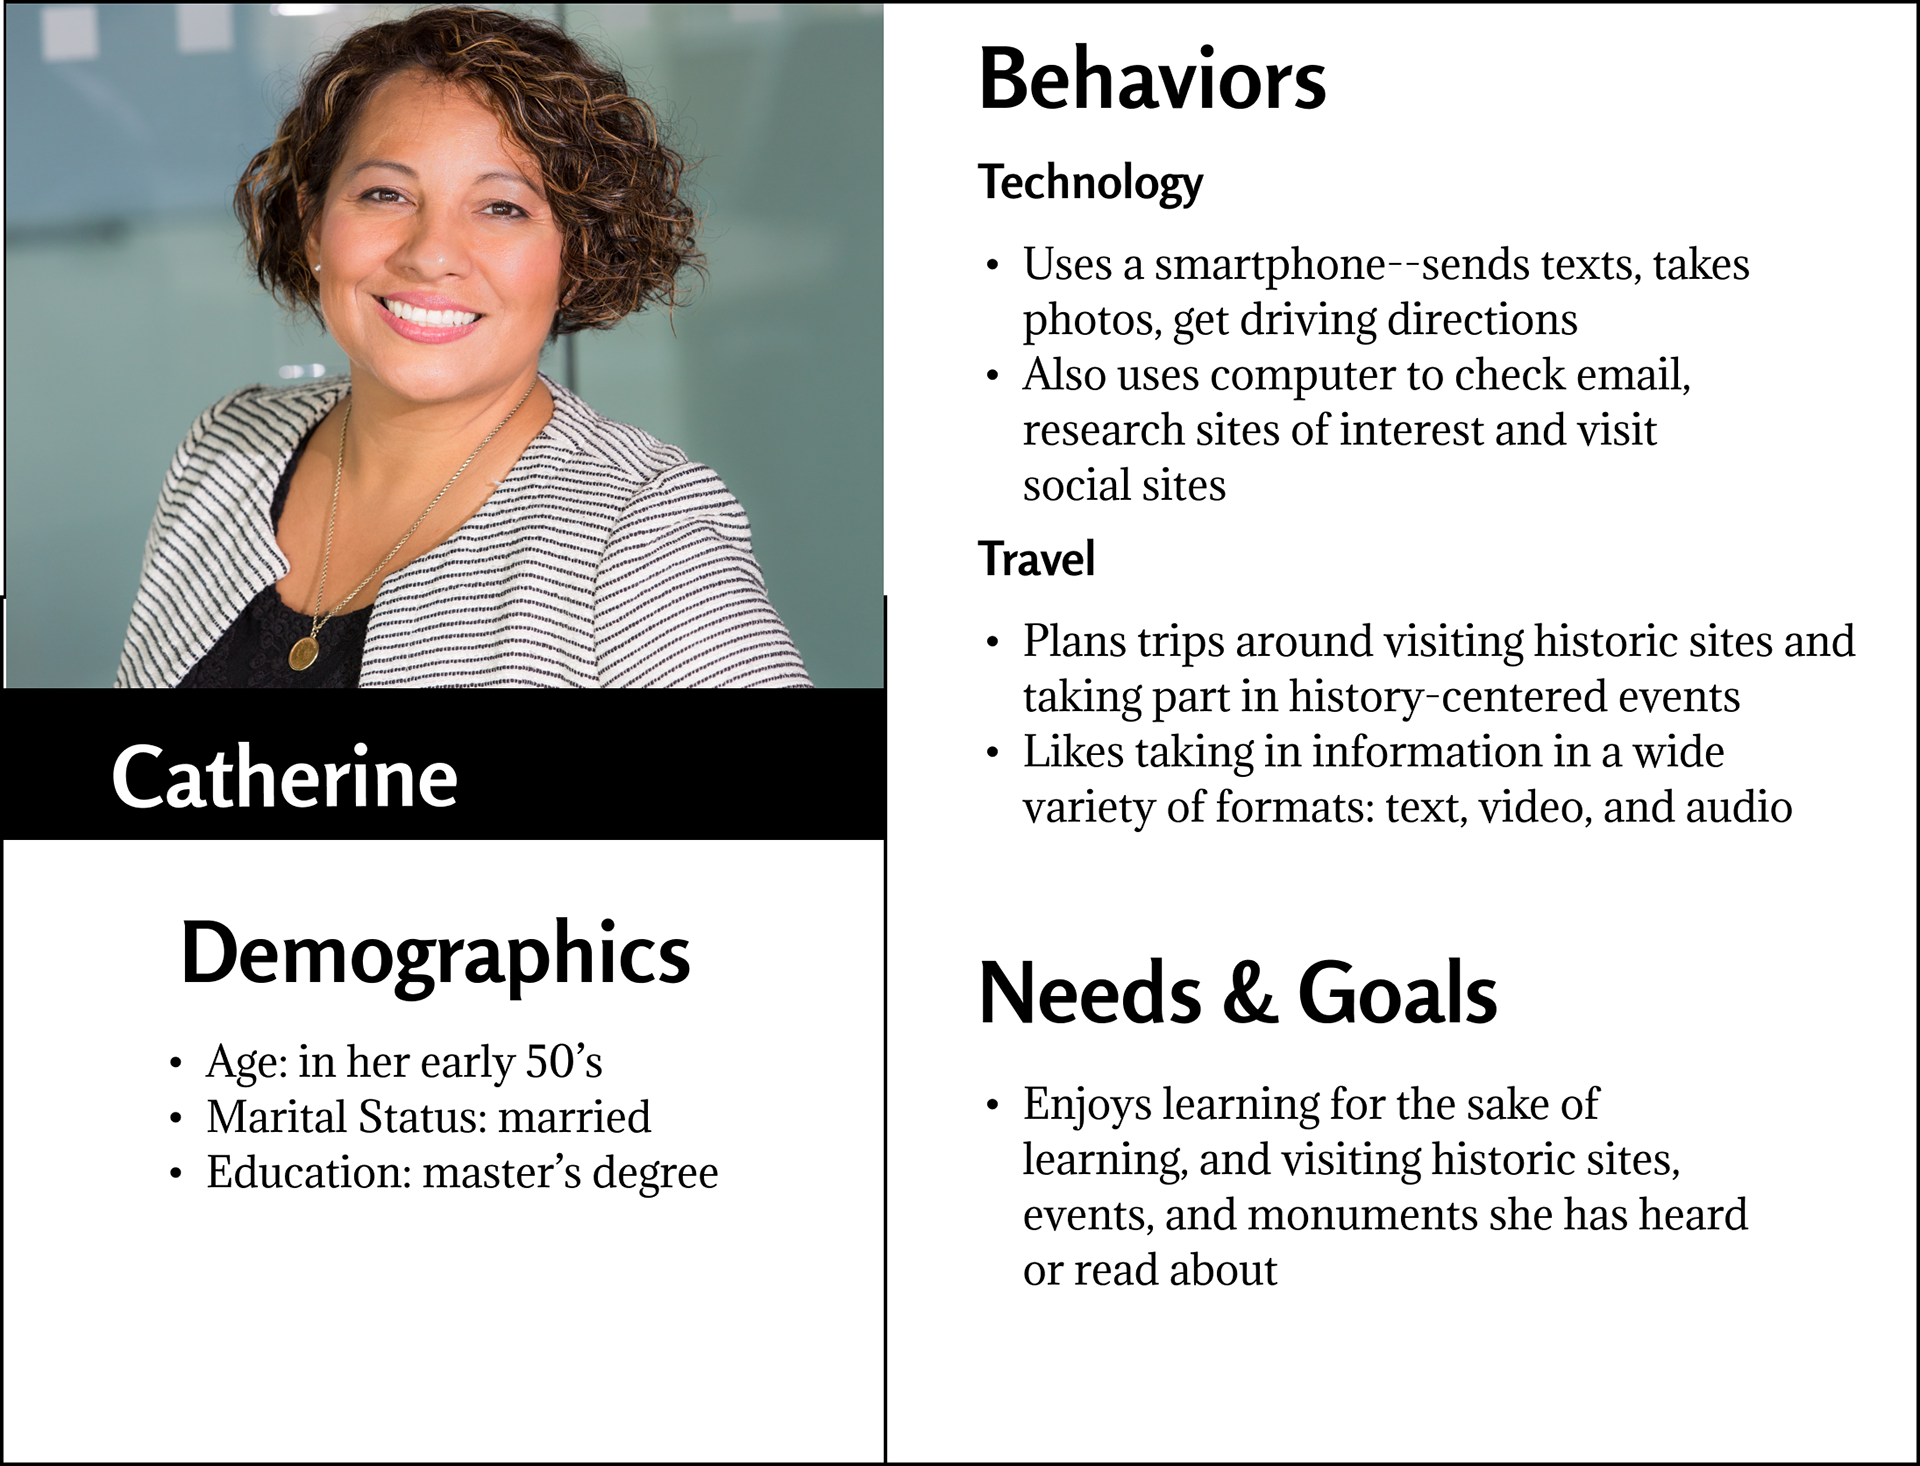
Persona Tile.
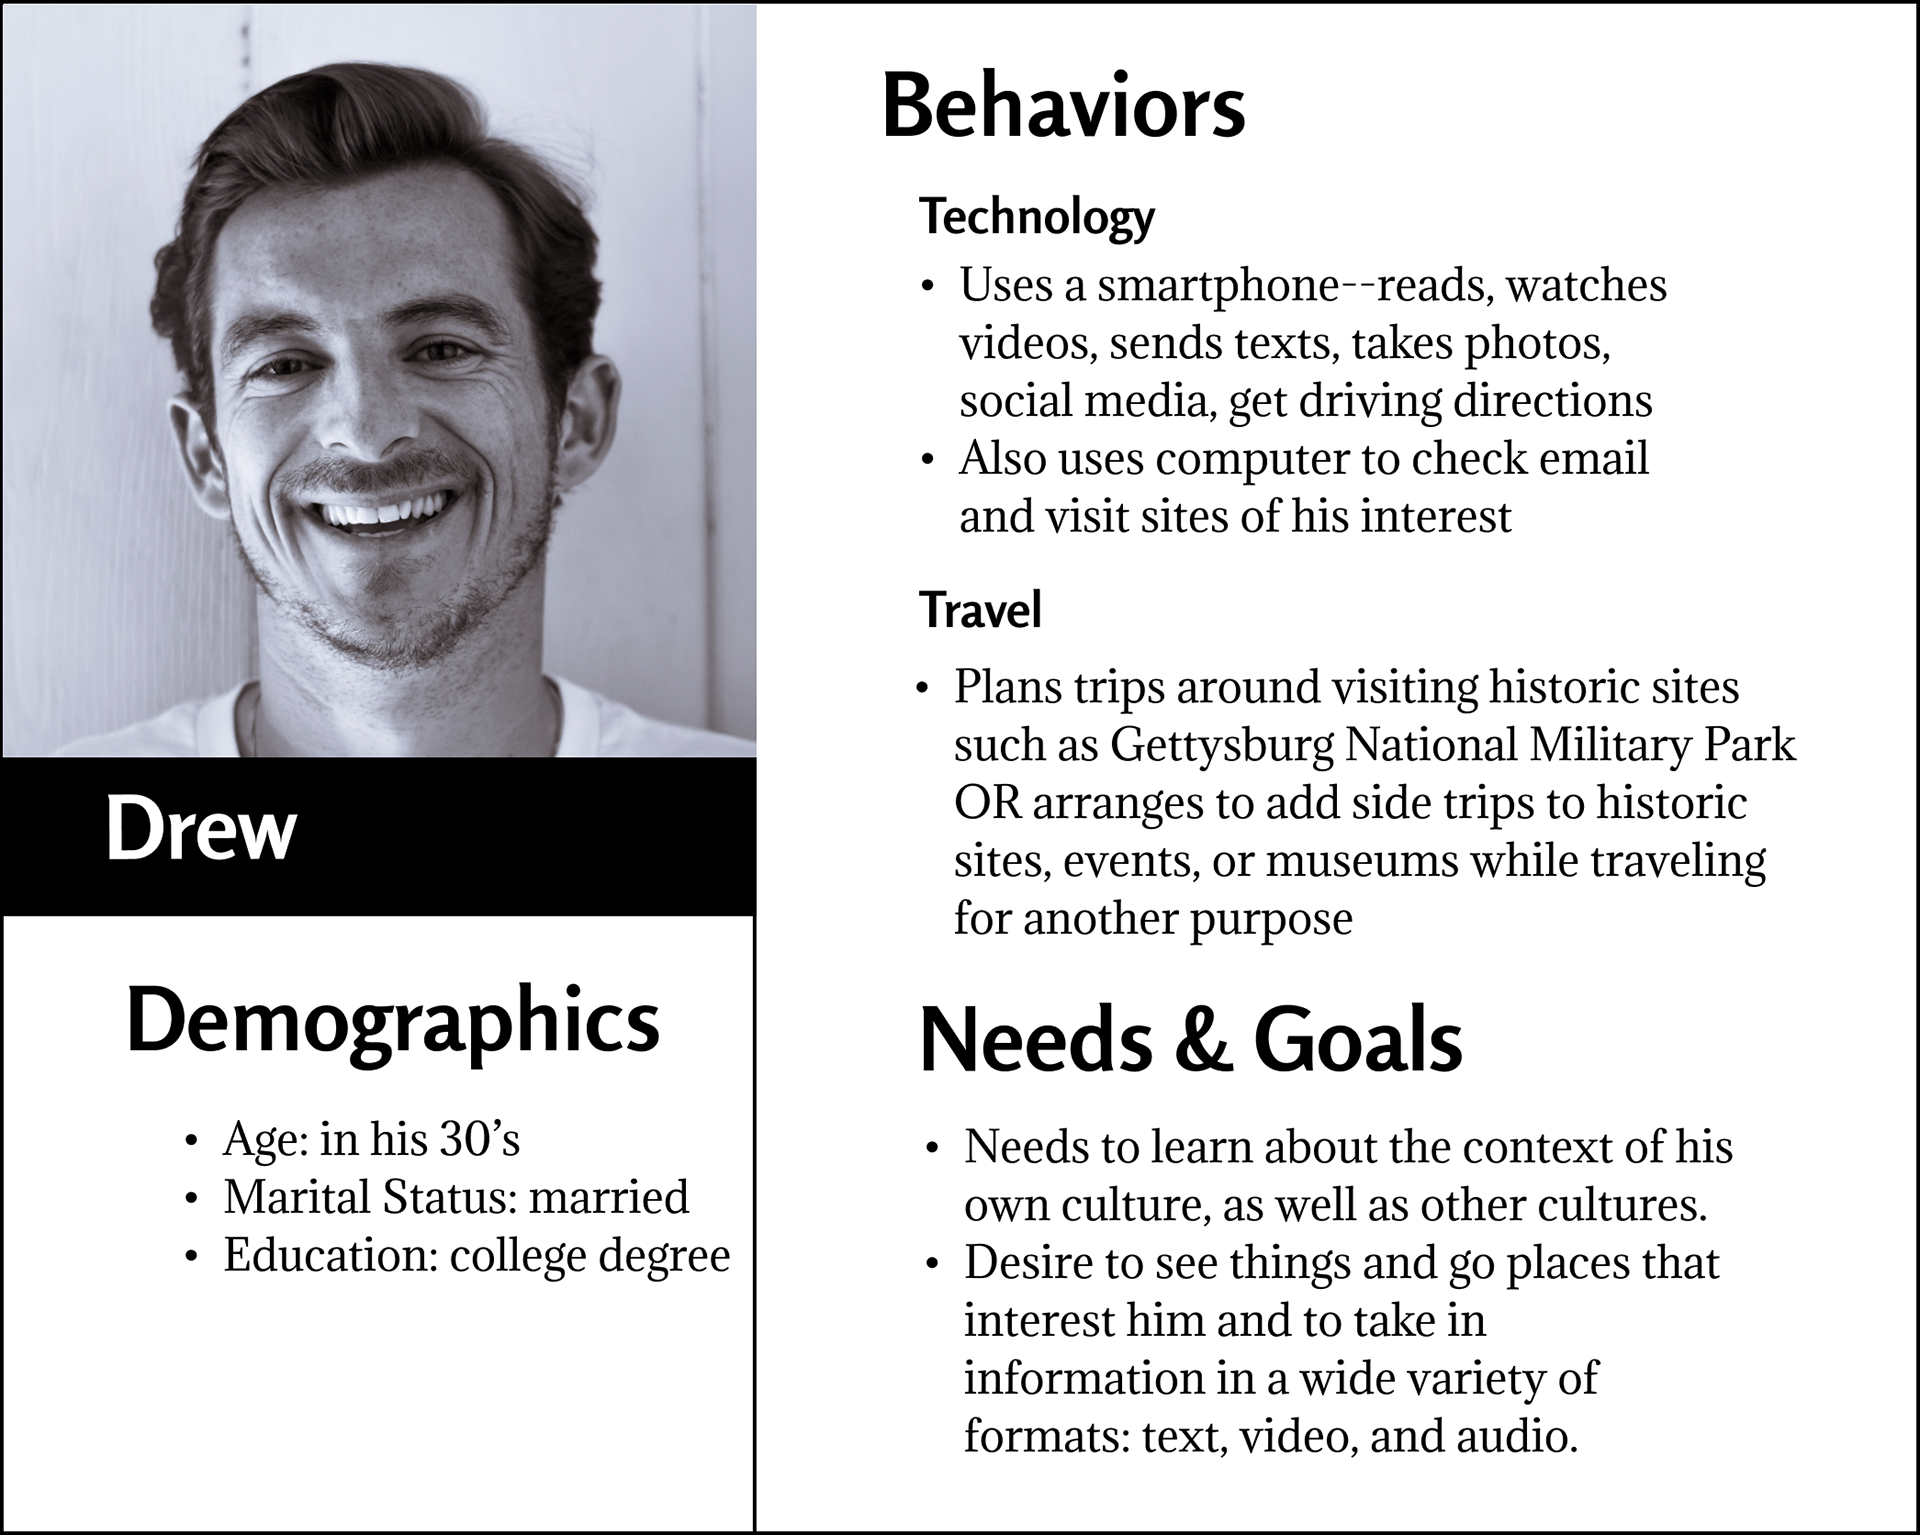
This persona tile presents characteristics of a potential app user.
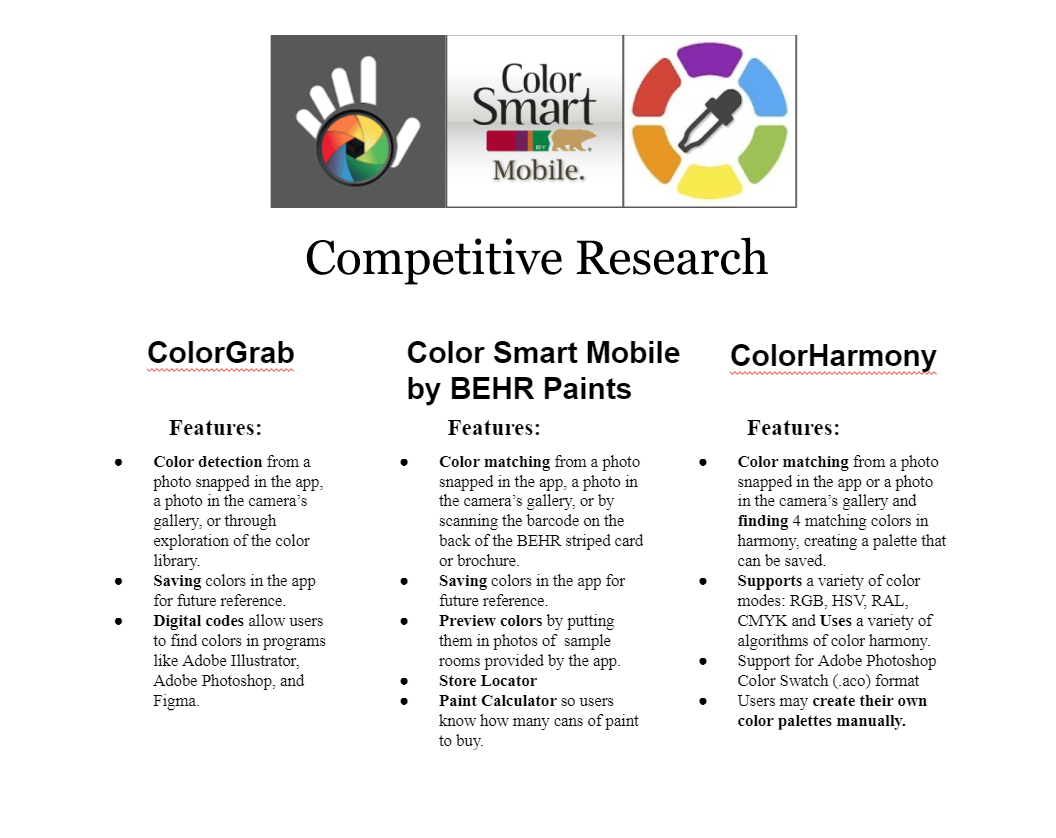
This tile presents competitive research for three color identification apps.
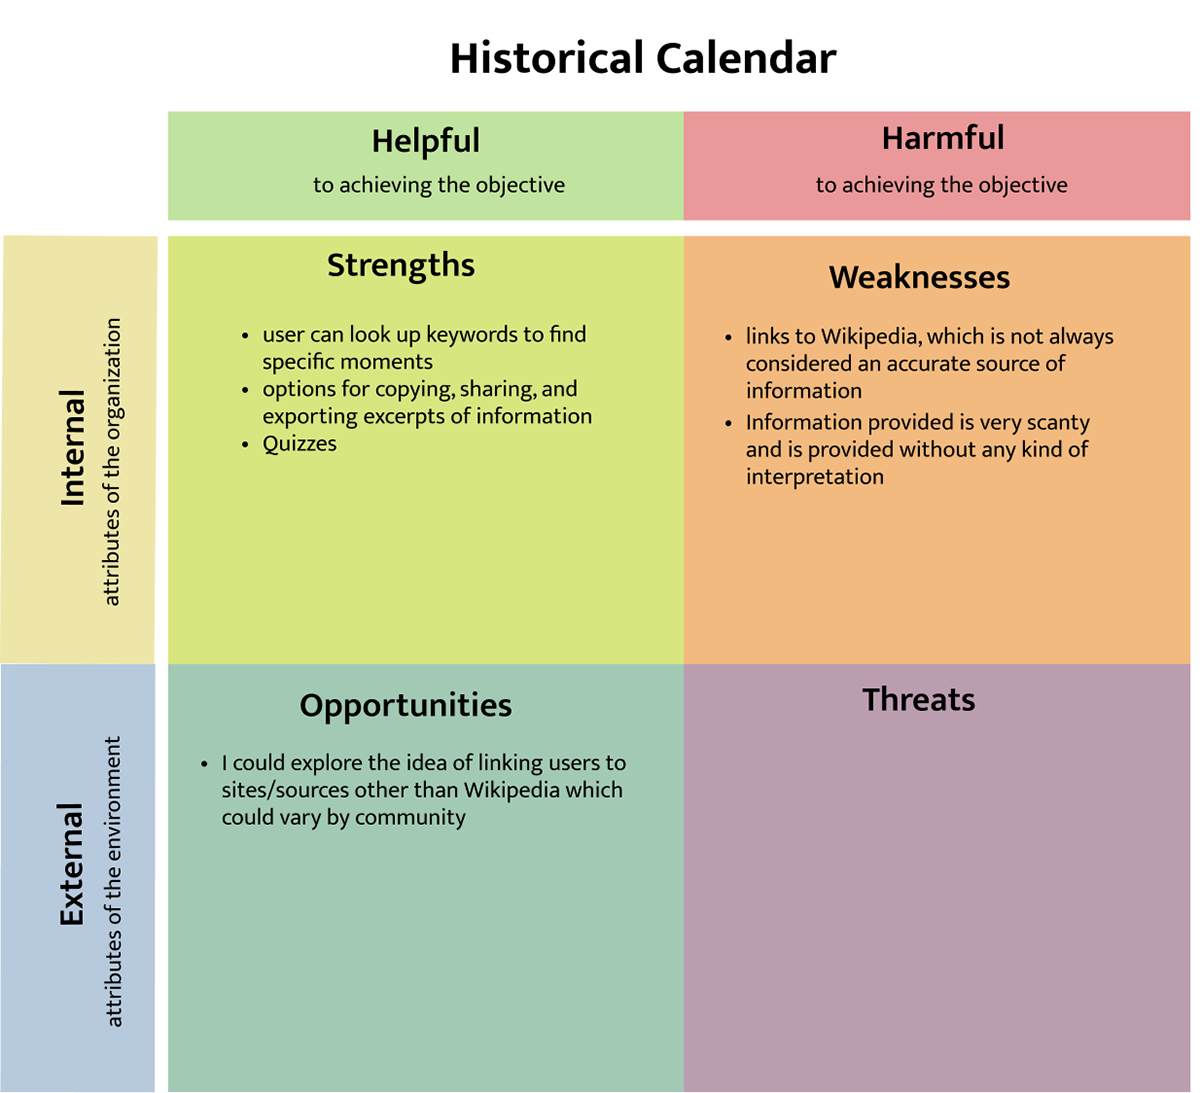
This 'SWOT' tile evaluates an app, listing its strengths, weaknesses, opportunities, and threats.
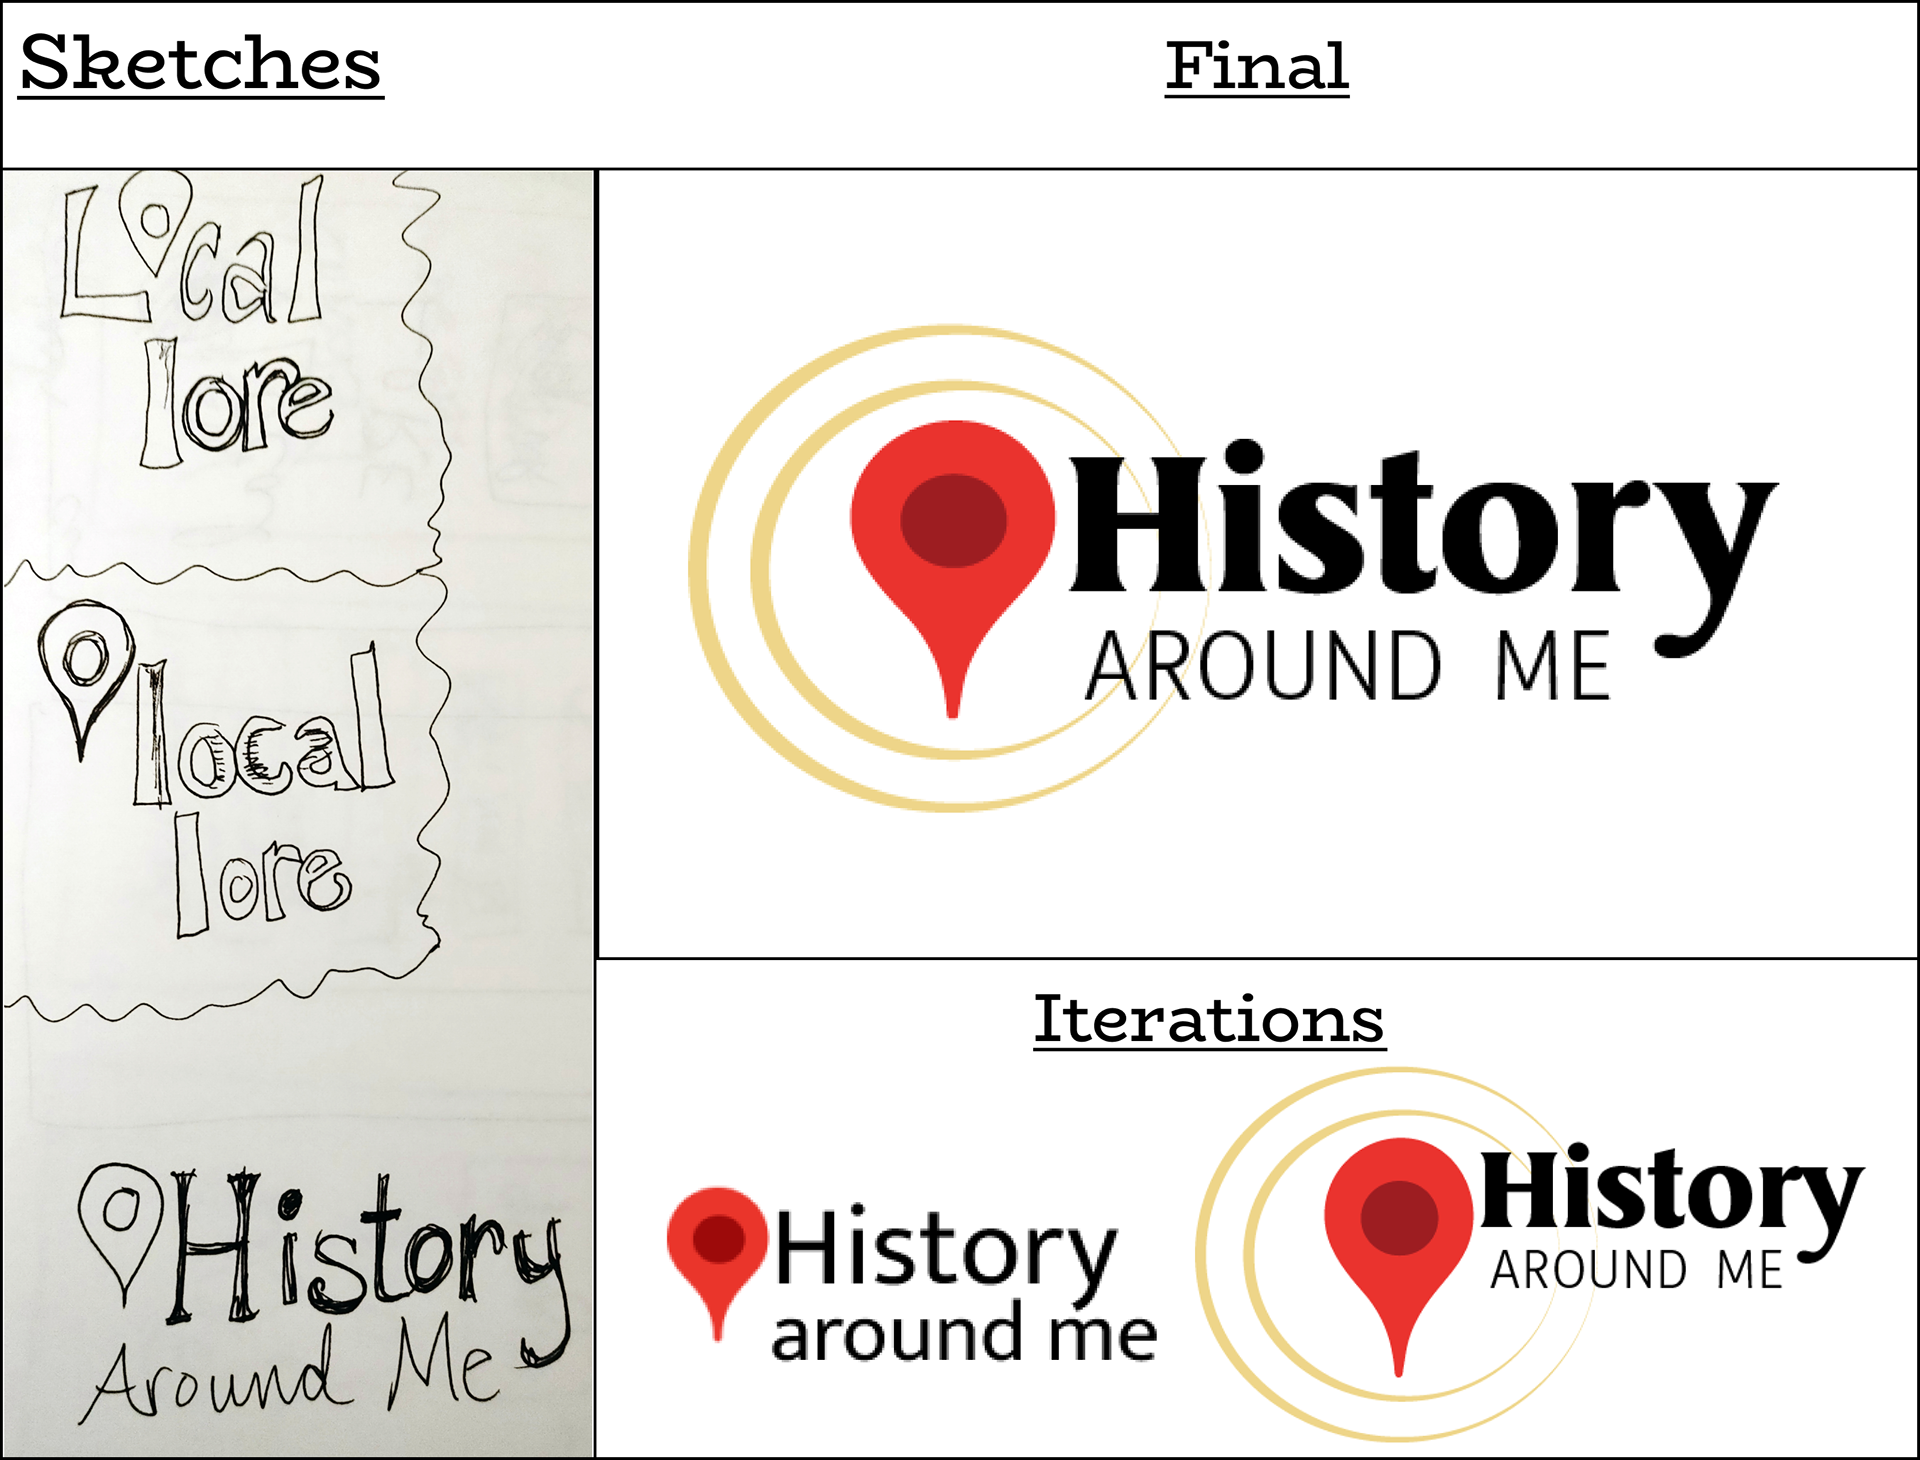
A tile displaying the development of the History Around Me logo.
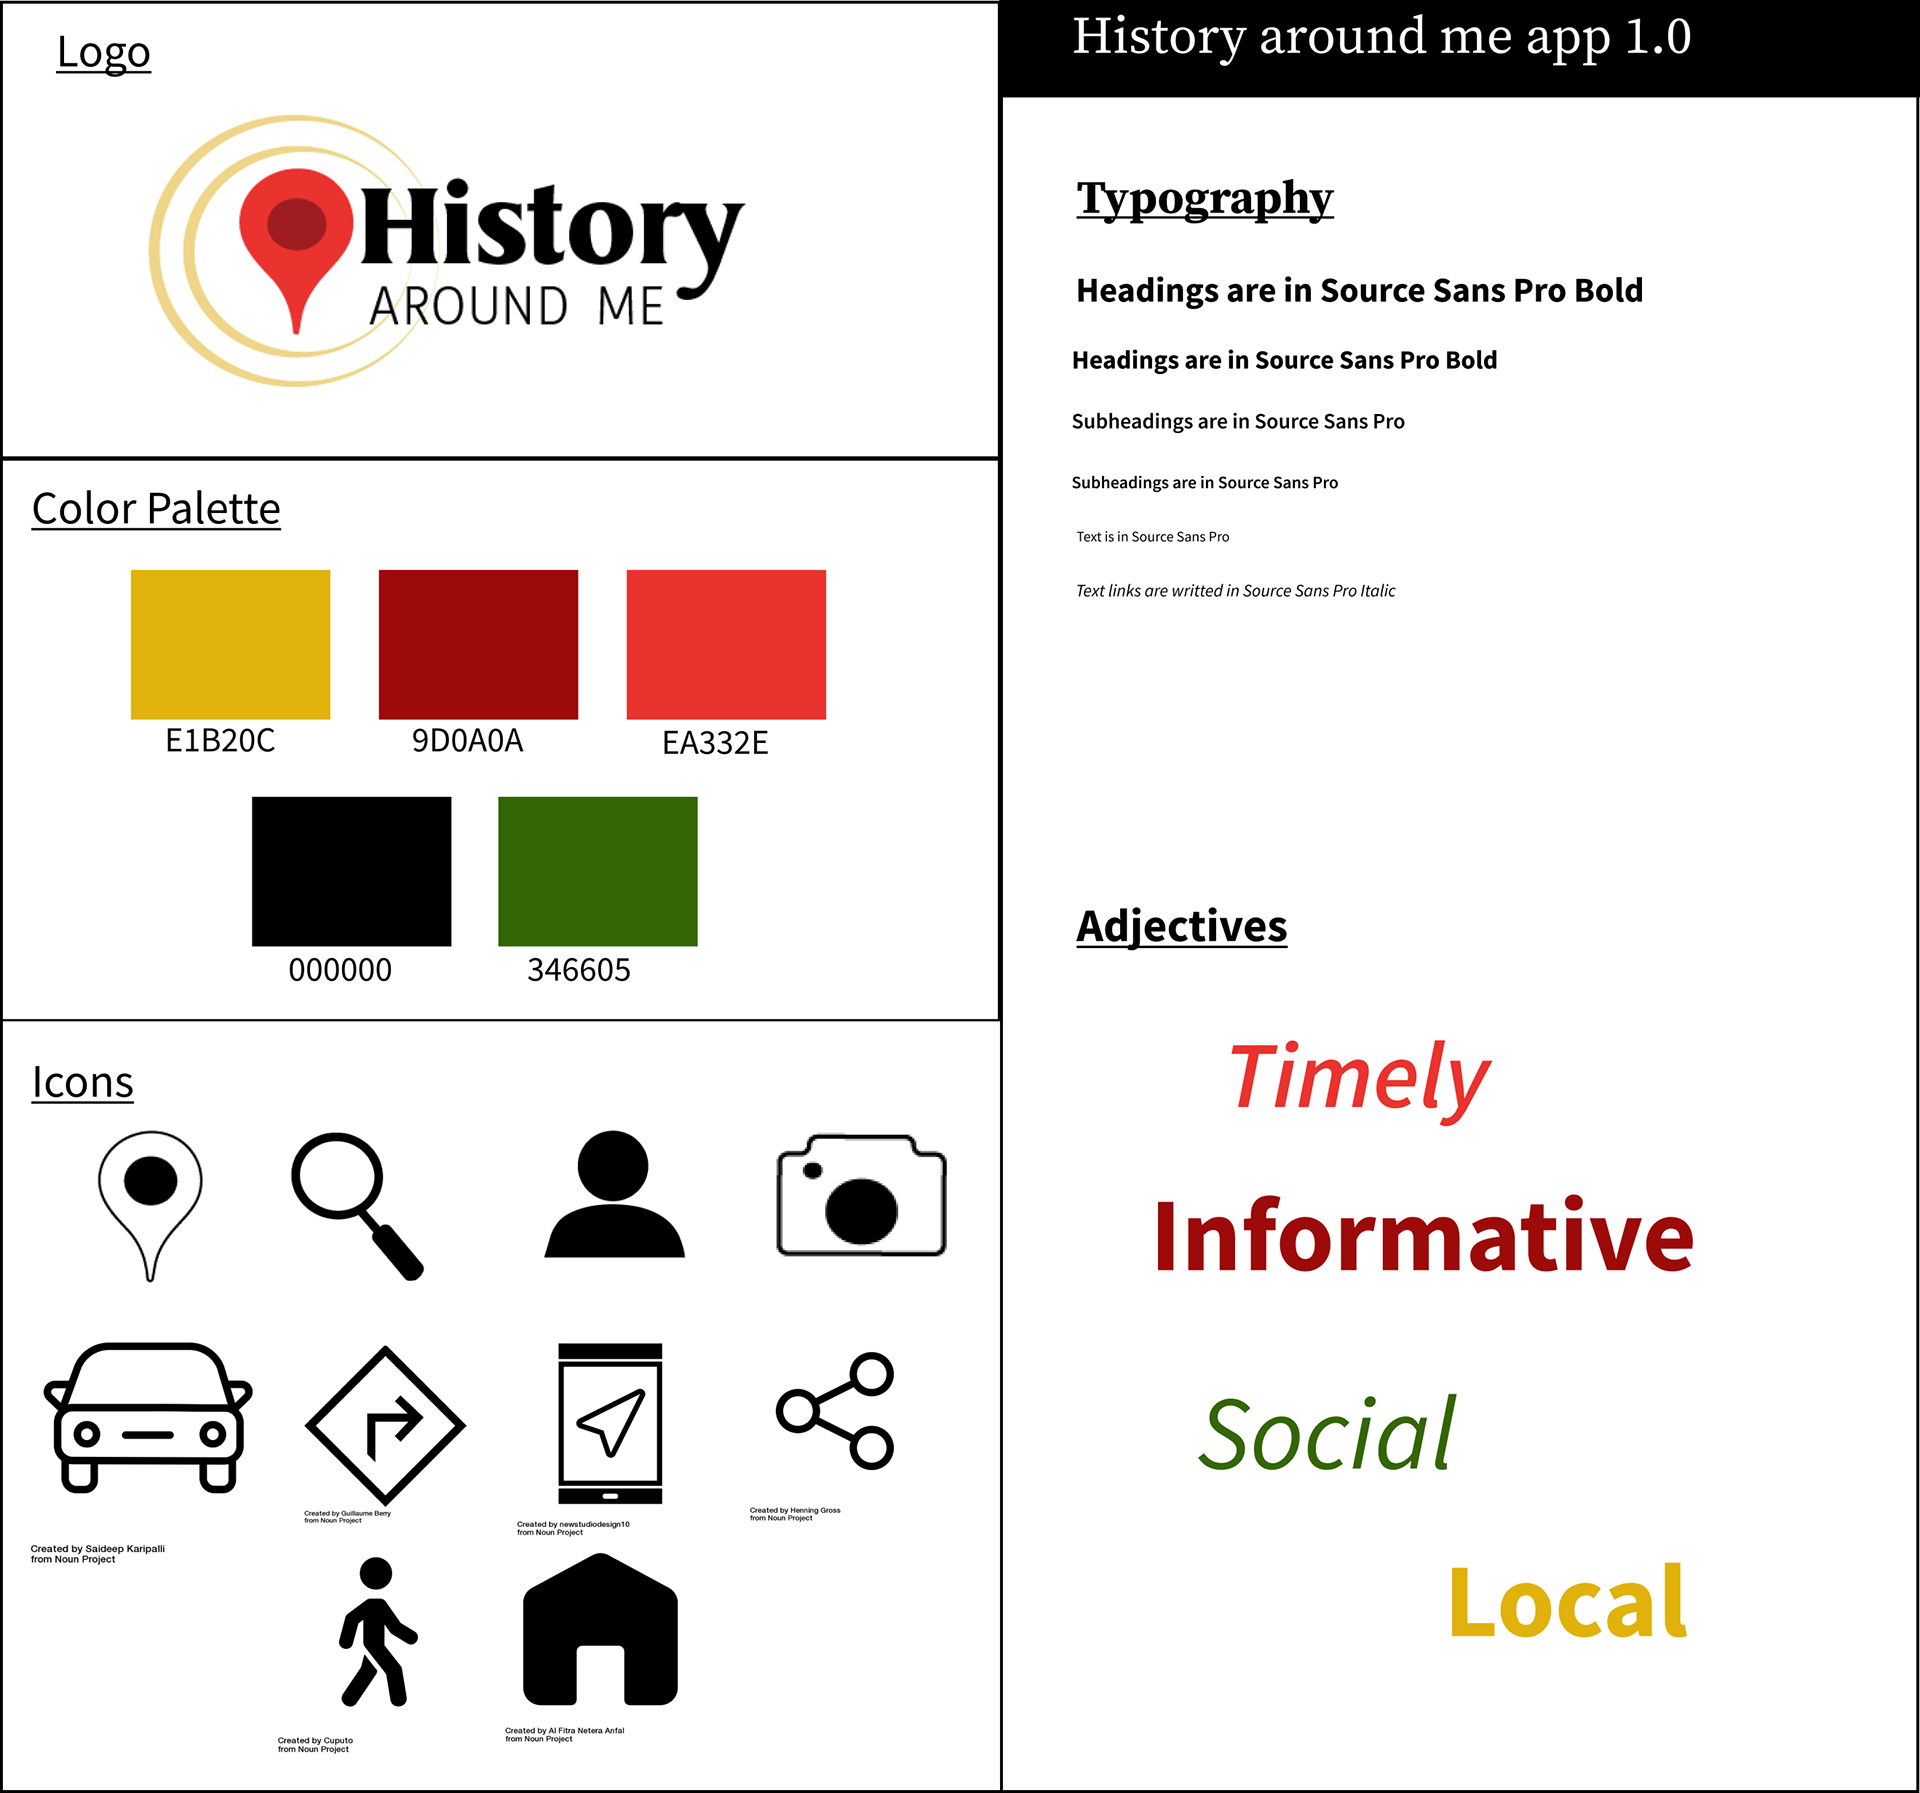
A style tile showing logo, color palette, text examples, and icons for an app.
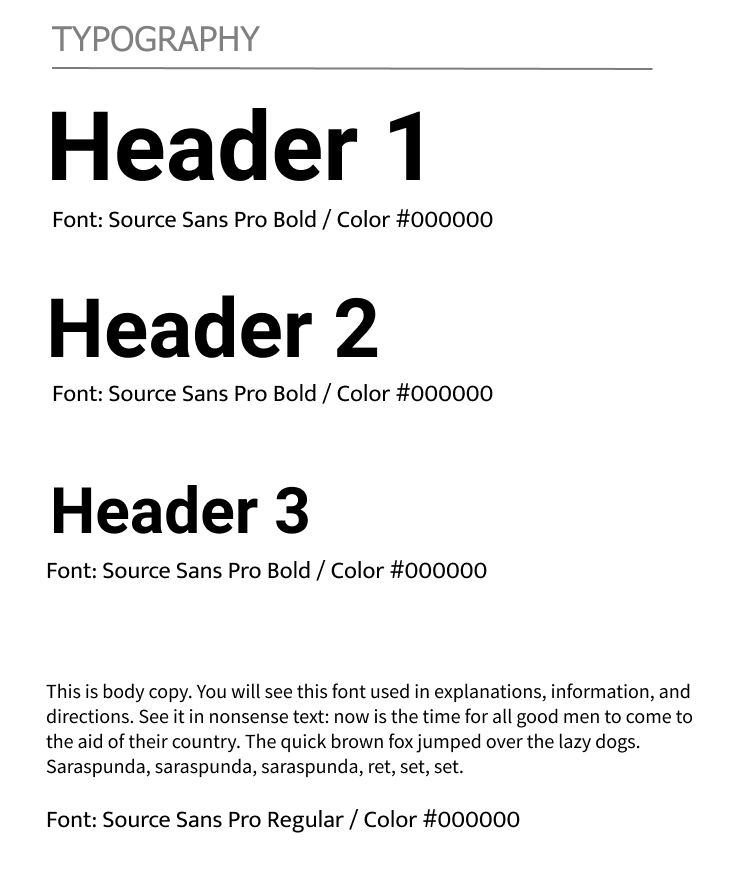
A graphic representation of the font for an app and the header sizes.